A better baseline for comparing sumo Elo across eras
I built an Elo explorer for every rikishi in the data set, from 1958 to the present. The first thing that bothered me was Taihō.
Taihō’s peak rating is 3,196. Hakuho’s is 3,773. That 577-point gap looks absurd if we read it as a direct comparison of greatness. Taihō won 787 of 939 recorded contested bouts, an 83.8% win rate. Hakuho won 1,181 of 1,418, or 83.3%. The results are very close. The raw ratings are not.
The obvious suspicion is Elo inflation. I wanted a simple diagnostic, so I calculated the average Elo of the top 50 rikishi at every basho, then averaged those basho values by calendar year.
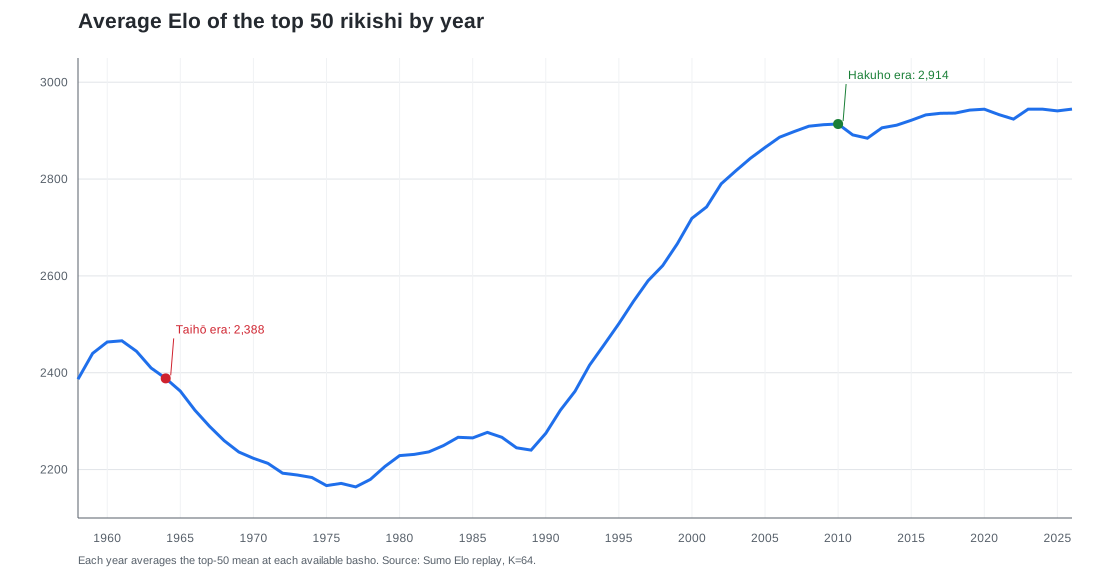
The line makes the problem visible. The annual top-50 average was 2,387 in 1958, fell to 2,164 in 1977, then rose through the 1990s and reached 2,914 in 2010 and 2,944 in 2026.
Sumo did not suddenly become 700 Elo points stronger. The rating scale moved underneath the wrestlers.
Why the rating pool drifts
Each individual bout is zero-sum. One rikishi gains exactly what the other loses. That does not guarantee a stable scale across decades.
New rikishi enter at fixed rank-based seeds. If those seeds are too low, established wrestlers take points from improving newcomers before the newcomers’ ratings catch up. Retired wrestlers keep their ratings in this replay, while new low-rated wrestlers continue to enter. The active pool changes even though old ratings remain frozen.
The rating network also becomes more connected over time. The modern data set has a deeper recorded lower-division pool and more links between generations. Later champions can build a rating through a longer chain of highly rated opponents. Taihō’s early environment is less connected, and the lower divisions before 1988 have incomplete bout records.
A large K-factor adds another effect. K=64 lets ratings respond quickly, which is useful for following form but makes peaks more sensitive to the exact sequence of wins and losses. It changes volatility more directly than the long-run average, but it can make the highest observations look more dramatic.
The line also falls for much of the 1960s and 1970s. That is a warning against calling every movement inflation. Some movement may reflect the rating mechanics, changes in the pool, and historical data coverage. The top-50 series is a calibration signal, not a measurement of the true quality of sumo in each year.
A simple calibration
Let B(t) be the mean Elo of the top 50 at time t. Pick a reference baseline, such as the 2026 value B(ref) = 2,944.
For a rating observed at time t, define:
calibrated Elo(t) = raw Elo(t) - B(t) + B(ref)
This preserves the gap between wrestlers competing at the same time. It shifts the whole elite field up or down to account for movement in the background scale.
Using the annual figures as a rough illustration:
- Taihō’s 1964 peak:
3,196 - 2,388 + 2,944 = 3,752 - Hakuho’s 2010 peak:
3,773 - 2,914 + 2,944 = 3,803
The raw gap falls from 577 points to about 51 points. That feels closer to what the two win rates and historical reputations suggest. It does not prove that the two men were equally strong. It shows how much of the original comparison depended on the calendar year in which the rating was earned.
For the actual calculation, I would use a basho-level top-50 baseline rather than the annual average. A rating recorded in January should be adjusted with the January field-strength estimate, not the average for the whole year. The annual chart is the diagnostic. The project page can later apply a smoothed basho-level calibration after further checks.
Why 50?
Fifty is a useful compromise for this pool.
A single top-rated wrestler is a noisy reference. One injury, a weak tournament, or a short run of new entrants can move the number. Averaging n observations reduces independent random noise roughly by 1/sqrt(n). At n = 50, the standard error is about 14% of the single-observation standard error. The ratings are correlated, so this is an intuition rather than an exact confidence interval, but the mean should still be much more stable than the champion’s rating or a top-five average.
Fifty is also large enough to describe the elite working field rather than just the yokozuna and ozeki. In this data, the top 50 usually contain about 39 Makuuchi wrestlers and 10 Jūryō wrestlers, with only occasional lower-division entries. That gives the measure enough depth to represent the field a dominant wrestler has to overcome while keeping it close to the top division.
The practical test is stability. I would compare top-25, top-50, and top-75 baselines. If the calibrated career rankings are similar, 50 is doing its job. If they differ sharply, the field size matters too much.
Is this an established idea?
The exact formula here is my adaptation to sumo, rather than a standard published sumo method. The underlying idea has precedents.
Jeff Sonas has used fixed rank groups such as the top 20, top 50, and top 100 to study historical chess rating inflation. His point is useful here: a fixed elite group gives a cleaner time series than the average rating of an entire pool whose size and composition keep changing. Sonas’s discussion also stresses that raw Elo is primarily a comparison among contemporaries.
A recent peer-reviewed paper by Maria Bolsinova, Bence Gergely and Matthieu Brinkhuis, “Keeping Elo alive”, studies bias and variance instability in Elo-based measurement systems. Their setting is educational testing, not sport, and their proposed solution changes the estimation process. My proposal leaves the replay untouched and normalises its output afterwards. The problems are related, but the methods are different.
A better historical comparison
My current view is that the top-50 mean is a reasonable era baseline. Sumo evolves, and a modern field may be deeper or more technically developed. The purpose of the adjustment is to measure an individual’s dominance against the elite field available in his own era, then put those dominance levels on a common scale.
That is a more defensible comparison than treating an unadjusted 1964 Elo and an unadjusted 2010 Elo as if they came from the same rating environment.
The interactive explorer is here: All-Division Sumo Elo Explorer.