OpenCode Go’s quota is the price
I am a big fan of OpenCode Go. For $10 a month after the first month, it gives developers access to a useful set of coding models, and the price feels almost absurdly low. I have always been slightly confused by the way the plan charges, though. The dollar amount is not really the useful number. OpenCode gives each model its own allowance, so the same monthly subscription buys very different numbers of requests: the current page lists $15 for Qwen3.8 Max, $60 for GLM-5.2, $60 for DeepSeek V4.1 Flash, and $30 for DeepSeek V4 Flash. A model’s price therefore tells you less than the fraction of its allowance consumed by one task. If a request costs c at public token prices and the model’s Go allowance is A, the useful quantity is:
\[\text{usage share} = \frac{c}{A} \times 100\%\]The page also gives separate peak and off-peak prices for the DeepSeek models, so this update uses off-peak prices for the comparison and names that choice explicitly.
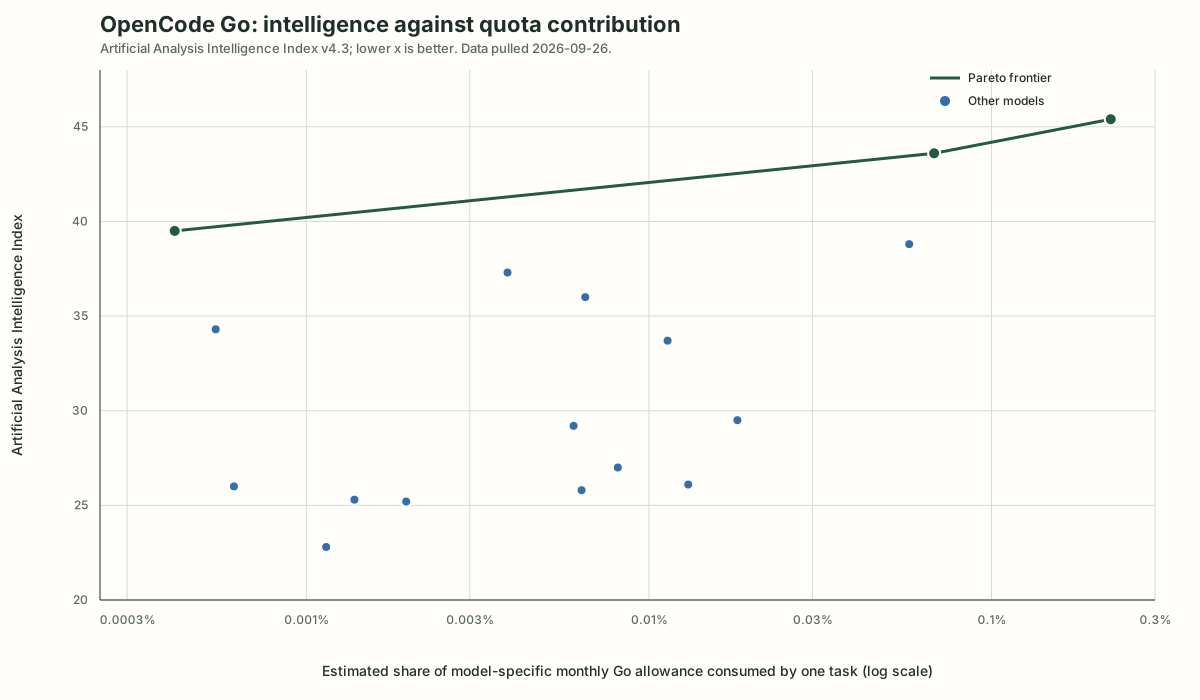
The green line is the Pareto frontier. Each point estimates the share of a model’s monthly OpenCode Go allowance consumed by one Artificial Analysis task. Lower and further left is cheaper; higher is a stronger Intelligence Index score.
I built this graph to make the comparison more concrete. I estimate the proxy cost of one Artificial Analysis task using OpenCode’s published input, cached-read, and output token patterns. In symbols:
\[c = \frac{\text{input tokens} \times \text{input price} + \text{cached tokens} \times \text{cache price} + \text{output tokens} \times \text{output price}}{1{,}000{,}000}\]I then divide c by the model-specific Go allowance. For models with peak and off-peak rows, the graph uses off-peak pricing, so it should be read as the lower-cost case. The result is a comparison instrument, not an invoice. The graph uses an Artificial Analysis Intelligence Index v4.3 snapshot pulled on 26 September, and keeps a model on the frontier when no model with a lower estimated Go usage share scores higher.
The current frontier is:
| Model | Intelligence Index | Estimated Go allowance used by one task |
|---|---|---|
| DeepSeek V4.1 Flash | 39.5 | 0.0004% |
| Kimi K3 | 43.6 | 0.0680% |
| Qwen3.8 Max | 45.4 | 0.2228% |
DeepSeek V4.1 Flash is now visible because OpenCode’s current model page lists it explicitly. It is a different model from DeepSeek V4 Flash, and the Artificial Analysis feed gives them different scores: 39.5 versus 34.3. The earlier graph incorrectly omitted the former and used the latter’s label for the wrong coverage claim.
These figures should not be quoted as a permanent ranking. OpenCode can change its model list, prices, allowances, and request assumptions, while Artificial Analysis can change its evaluations. I will update the graph manually, so treat it as a reference for thinking about the plan, not as a live billing calculator.